原地址:
lab1
简介 实验主要是分为三个部分。
第一部分主要是需要熟悉x86的汇编语言,QEMU x86模拟器,以及PC上电之后的启动流程。
第二部分是验证6.828内核的boot loader,这里部分需要看的代码主要是位于boot目录。
第三部分主要是开始实施JOS操作系统。也就是MIT 6.828的内核部分。
软件的设置 首先我的环境是沿用了Linux-2.6.26内核调试环境搭建 里面的环境。
mkdir ~/6.828
cd ~/6.828
git clone https://pdos.csail.mit.edu/6.828/2017/jos.git lab
cd lab
第一部分: PC Bootstrap 这个练习的作用完全是为了让你熟悉一下x86的汇编语言。以及PC启动的流程。并且可以熟练地使用QEMU/QEMU和GDB来调试了。在这里的实验里面你并不需要写任何的代码。但是需要有足够的理解来回答相应的问题。
Getting Started with x86 assembly
注意:这本书用的汇编语法是采用的NASM。但是在后面做实验的过程却是需要使用GAS语法。也就是AT & T的语法。 Brennan’s Guide to Inline Assembly。
介绍了一些关于内联汇编需要注意的地方。关于内联汇编,可以看下面两本书
Linux内核完全剖析 赵炯
Linux内核情景分析
这两本书里面都讲到了C语言里面会用到的内联汇编。实际上,除此之外,也可以看一下xv6的代码。然后注意一下里面inline assemble的写法。
Exercise 1. 这里主要是为了熟悉硬件&汇编的。所以并不做过多的介绍。只是把资源记在这里面。
the 6.828 reference page 提供了各种关于汇编的资料。
推荐阅读 in Brennan’s Guide to Inline Assembly. 内联汇编语法。
短一点的关于80386硬件特性 80386 Programmer’s Reference Manual
X86详细的架构信息 IA-32 Intel Architecture Software Developer’s Manuals
Simulating the x86
在作业里面并没有使用真实的PC,而是使用的是QEMU的模拟器。通过这个模拟器,可以很方便地与GDB一起合作,打断点什么的。Linux-2.6.26内核调试环境搭建 这里面已经上手玩过一次了。
在6.828里面,主要还是继续使用QEMU。一个现代的模拟器。
+ as kern/entry.S
+ cc kern/entrypgdir.c
+ cc kern/init.c
+ cc kern/console.c
+ cc kern/monitor.c
+ cc kern/printf.c
+ cc kern/kdebug.c
+ cc lib/printfmt.c
+ cc lib/readline.c
+ cc lib/string.c
+ ld obj/kern/kernel
+ as boot/boot.S
+ cc -Os boot/main.c
+ ld boot/boot
boot block is 380 bytes (max 510)
+ mk obj/kern/kernel.img
注意 (由于我的实验环境采用的是32位的系统,不会存在这个问题。)
(If you get errors like "undefined reference to `__udivdi3'" , you probably don't have the 32-bit gcc multilib. If you' re running Debian or Ubuntu, try installing the gcc-multilib package.)
当make执行完成之后,运行结果就会生成obj/kern/kernel.img磁盘文件。利用这个虚拟的磁盘来启动一个PC。
or
尽量还是使用make qemu-nox,因为这种方式,在没有桌面环境的情况下也是可以正常工作的。
# make qemu-nox
Booting from Hard Disk...
6828 decimal is XXX octal!
entering test_backtrace 5
entering test_backtrace 4
entering test_backtrace 3
entering test_backtrace 2
entering test_backtrace 1
entering test_backtrace 0
leaving test_backtrace 0
leaving test_backtrace 1
leaving test_backtrace 2
leaving test_backtrace 3
leaving test_backtrace 4
leaving test_backtrace 5
Welcome to the JOS kernel monitor!
Type 'help' for a list of commands.
K>
如果想要退出Qemu,那么只需要执行: Ctrl+a x.
There are only two commands you can give to the kernel monitor, help and kerninfo.
K> help
help - display this list of commands
kerninfo - display information about the kernel
K> kerninfo
Special kernel symbols:
entry f010000c (virt) 0010000c (phys)
etext f0101a75 (virt) 00101a75 (phys)
edata f0112300 (virt) 00112300 (phys)
end f0112960 (virt) 00112960 (phys)
Kernel executable memory footprint: 75KB
K>
仅管看起来很简单。但是实际上这里面生成的obj/kern/kernel.img文件是可以放到真实的物理硬件上来执行的。
批注 :上面的内容其实动手的部分不多。大部分还是要求去熟悉汇编。怎么讲呢?最好的还是用到的时候再学吧。
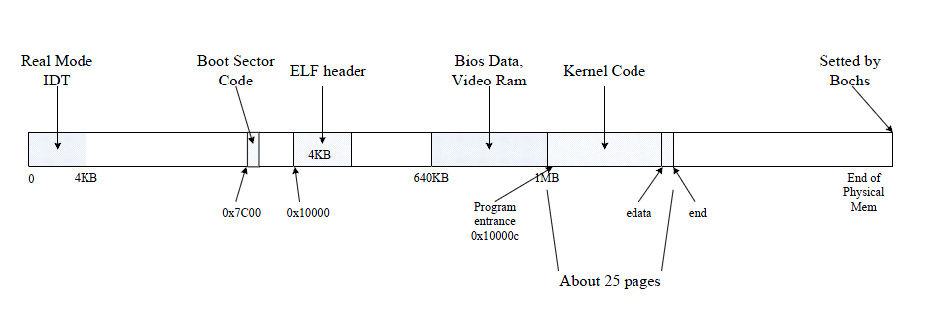
The PC’s Physical Address Space 接下来会介绍PC的启动。一个PC的物理地址空间可以分成以下组成。We will now dive into a bit more detail about how a PC starts up. A PC's physical address space is hard-wired to have the following general layout:
+------------------+ <- 0xFFFFFFFF (4GB)
| 32-bit |
| memory mapped |
| devices |
| |
/\/\/\/\/\/\/\/\/\/\
/\/\/\/\/\/\/\/\/\/\
| |
| Unused |
| |
+------------------+ <- depends on amount of RAM
| |
| |
| Extended Memory |
| |
| |
+------------------+ <- 0x00100000 (1MB)
| BIOS ROM | 64KB
+------------------+ <- 0x000F0000 (960KB)
| 16-bit devices, |
| expansion ROMs |
+------------------+ <- 0x000C0000 (768KB)
| VGA Display | 128KB
+------------------+ <- 0x000A0000 (640KB)
| |
| Low Memory |
| |
+------------------+ <- 0x00000000
为了兼容性的考虑。PC在一开始是16位的。但是地址线却有20位。也就是能够寻址1MB的地址空间。其中640KB为低端内存。1024KB - 640KB = 384KB。这384KB的范围就是0x000A0000 ~ 0x000FFFFF。
其中BIOS占掉了顶端的64KB的内存。尽管后来内存从1MB前进到了16MB,后来又进展到了4GB。但是PC的内存布局还是没有改变。主要是为了兼容性考虑。因此,32位的CPU在这里还是会有个洞。0x000A0000 〜 0x00100000。
原本低端内存可以连续的1MB,变成了两段
即
“conventional memory” (the first 640KB)
“extended memory” 1MB以上
最新的x86架构可以支持4GB以上的物理内存了。所以RAM也可以扩展到0xFFFFFFFF以上的地址。在这种情况下BIOS需要设置第二个洞。也就是在32位地址的顶端。但是JOS目前来说,只是支持256MB的物理内存。所以这里设计时只考虑到了具有32位地址的地址空间的情况。
The ROM BIOS 接下来的操作里面,你会用到QEMU的debug功能来深入了解IA-32计算机的启动流程。
一个窗口运行make qemu-nox-gdbmake gdb
GNU gdb (GDB) 6.8-debian
Copyright (C) 2008 Free Software Foundation, Inc.
License GPLv3+: GNU GPL version 3 or later <http://gnu.org/licenses/gpl.html>
This is free software: you are free to change and redistribute it.
There is NO WARRANTY, to the extent permitted by law. Type "show copying"
and "show warranty" for details.
This GDB was configured as "i486-linux-gnu" .
+ target remote localhost:26000
The target architecture is assumed to be i8086
[f000:fff0] 0xffff0: ljmp $0xf000 ,$0xe05b
0x0000fff0 in ?? ()
+ symbol-file obj/kern/kernel
(gdb)
这里能够通过gdb一下子就连接上来,这是因为提供了一个.gdbinit文件,能够自动地attach到想要调试的程序上来。当然前提是已经把这个debug的程序运行起来的情况。ljmp。
[f000:fff0] 0xffff0: ljmp $0xf000 ,$0xe05b
从这个要执行的指令可以看出来。
IBM PC开始执行的物理位置是0x000ffff0。这个是位于1MB里面的很高的地址。也就是ROM BIOS最顶上64KB的顶部。
[f000:fff0]可以看出来,此时CS = 0xf000 and IP = 0xfff0.
如果执行完这条指令之后 CS = 0xf000 and IP = 0xe05b.CS = 0xf000 and IP = 0xfff0。
注意16位的寻址模式
: physical address = 16 * segment + offset.
16 * 0xf000 + 0xfff0
= 0xf0000 + 0xfff0
= 0xffff0
1MB尾巴上的地址就是0xffff0 + 16bytes。除了放个ljmp之外,你也不要指望16bytes能做啥了。
Exercise 2. 用gdb的si指令来单步执行。看一下在启动的时候都做了些什么。可能需要查看的资料是Phil Storrs I/O Ports Description in 6.828 reference materials page.
不需要非常详细,只需要大概了解一下就可以了。
当BIOS在运行的时候。会在内存的超始地址处建立一个各种设备的16位的中断向量表,并且初始化各种设备。利用这个中断向量表,就可以成功输出”Start SeaBIOS”这种信息。
当各种初始化的硬件设备工作做完之后。BIOS就开始找启动设备,最终会在硬盘的起始sector里面找0x55, 0xaa这标志位的扇区。如果有,就加载到0x7c00处开始运行。也就是(31KB)的位置。
Part 2: The Boot Loader 软盘和磁盘一般都是被切分为512 byte区域,也就是扇区。一个扇区是一个块设备的最小传输单位。每次读写都是必须是扇区的整数倍。
对于CD-ROM的支持,需要看 “El Torito” Bootable CD-ROM Format Specification.
这里需要好好地读一下这个文件。然后知道这两个文件做了些啥。1.2.7 and 1.2.8 of PC Assembly Language 进行了介绍。 Intel architecture manuals也对这个有详细介绍。
在16位模式下只需要考虑段地址。boot loader读了kernel。从硬盘到内存。在操作的时候走的是PC的寄存器操作。如果想要了解更多,可以读一下"IDE hard drive controller" in the 6.828 reference page.的这一部分。
当你理解了boot loader的源码之后。接下来可以看一下obj/boot/boot.asm。b *0x7c00就可以把断点设置在0x7c00`。
b *0x7c00
si 表示单步执行
si 2 表示接着执行两条指令
c 表示不再单步执行。直接开始运行了
查看内存中的指令,有时候可能需要查看内存操作的结果。这个时候需要用
x/i 调试命令
x/Ni 基中N是指令的数目; 会把指定内存里面的指令翻译成汇编。
Exercise 3. 特别需要注意看一下lab tools guide。里面介绍了很多GDB命令的section。这些命令对于开发操作系统特别有帮助。0x7c00这里设置一个断点。这个位置是启动扇区被加载到的内存位置。持续执行,一直跑到那个断点那里(按一下c就可以一直跑到断点那里了 )。大概看一下boot/boot.S里面的代码。并且注意看一下obj/boot/boot.asm来跟踪当前所处的位置。
也可以用x/i命令来查看内存里面的汇编指令。并且与原本的boot loader 里面的代码进行比较。
接下来就可以通过bootmain函数进入到boot/main.c里面。然后开始执行readsect函数。注意readsect里面的汇编指令。一路跟踪readsect函数的执行,然后回到bootmain函数。
一直到读完余下的磁盘上的内核扇区。找出当循环结之后,会跳到哪里去执行?(肯定是跳到内核的第一条指令那里开始执行了)需要在那里设置一个断点。
接下来就需要回答如下问题:At what point does the processor start executing 32-bit code? What exactly causes the switch from 16- to 32-bit mode?
Q: 在哪里CPU开始进入到32 位模式。
哪条指令是带来了16 位到32 位的切换。
A:
movl %eax, %cr0
这条指令把cr0寄存器的最后一位,即PE位打开。也就是开启了保护模式。
只不过必须要清空一下流水线。这是规定。
# Jump to next instruction, but in 32-bit code segment.
# Switches processor into 32-bit mode.
ljmp $PROT_MODE_CSEG, $protcseg
需要注意的是,在长跳转的时候,$PROT_MODE_CSEG。
也就是lgdt已经是设置好的。
What is the last instruction of the boot loader executed, and what is the first instruction of the kernel it just loaded?
Q: boot loader执行的最后一条指令是什么?kernel执行的第一条指令是什么?
A:
这个最简单的办法是打开obj/boot/boot.asm。找到bootmain函数的最后一条指令就可以了。
// call the entry point from the ELF header
// note: does not return !
((void (*)(void)) (ELFHDR->e_entry))();
7d61: ff 15 18 00 01 00 call *0x10018
就是main.c中这个代码
((void (*)(void)) (ELFHDR->e_entry))();
Where is the first instruction of the kernel?
movw $0x1234,0x472 # warm boot
也可以通过命令查看:
$ objdump -f kernel
kernel: file format elf32-i386
architecture: i386, flags 0x00000112:
EXEC_P, HAS_SYMS, D_PAGED
start address 0x0010000c
How does the boot loader decide how many sectors it must read in order to fetch the entire kernel from disk? Where does it find this information?
Q: boot loader在加载kernel的时候,是如何决定有多少个扇区需要读取的?
这部分信息是如何确定?
A: 详细的信息会涉及到较多的ELF头文件格式。
void bootmain (void )
{
struct Proghdr *ph, *eph;
readseg((uint32_t ) ELFHDR, SECTSIZE*8 , 0 );
if (ELFHDR->e_magic != ELF_MAGIC)
goto bad;
ph = (struct Proghdr *) ((uint8_t *) ELFHDR + ELFHDR->e_phoff);
eph = ph + ELFHDR->e_phnum;
for (; ph < eph; ph++)
readseg(ph->p_pa, ph->p_memsz, ph->p_offset);
((void (*)(void )) (ELFHDR->e_entry))();
bad:
outw(0x8A00 , 0x8A00 );
outw(0x8A00 , 0x8E00 );
while (1 )
;
}
void readseg (uint32_t pa, uint32_t count, uint32_t offset)
{
uint32_t end_pa;
end_pa = pa + count;
pa &= ~(SECTSIZE - 1 );
offset = (offset / SECTSIZE) + 1 ;
while (pa < end_pa) {
readsect((uint8_t *) pa, offset);
pa += SECTSIZE;
offset++;
}
}
虽然作业里面有个问题没有被问到。但是实际上是值得自己思考的。那就是。如果自己在写代码的时候,写的代码如下:
编译链接之后,a和p都会有个地址。这个地址应该就是程序员看到的虚拟地址空间的地址。平时自己写C程序可以不用关心这个虚拟地址与物理地址的对应。因为操作系统会利用分页技术把这个虚拟地址与真实的物理地址做好相应的对应。
但是整个kernel加载的虚拟地址是0xF0100000。
这个时候就需要认真想一想了。是不是加载到虚拟地址0xF0200000也可以?物理地址的设定是什么?
思路如下:
kernel在编译的时候,采用的虚拟地址是0xF0100000。
这是是在链接定义文件
kern/kernel.ld指定的链接的起始地址。
root@debug:~/6.828/lab
/* Link the kernel at this address: "." means the current address */
. = 0xF0100000;
/* AT(...) gives the load address of this section, which tells
the boot loader where to load the kernel in physical memory */
.text : AT(0x100000) {
*(.text .stub .text.* .gnu.linkonce.t.*)
}
kernel在加载到的物理地址是#define ELFHDR ((struct Elf *) 0x10000)
这两者之间的映射关系与用户的用应程序没有什么实质上的差异。也是通过页表来实现的。
完成了内核页表的设置。
__ attribute__((__ aligned__(PGSIZE)))
pde_t entry_pgdir[NPDENTRIES] = {
[0 ]
= ((uintptr_t )entry_pgtable - KERNBASE) + PTE_P,
[KERNBASE>>PDXSHIFT]
= ((uintptr_t )entry_pgtable - KERNBASE) + PTE_P + PTE_W
};
这里把物理起始地址4MB以及0xF0000000这里的4MB都映射到物理地址的[0, 4MB)
Loading the Kernel 接下来就可以仔细地看一下C语言里面的内容。这里主要是看boot loader里面的C语言。即boot/main.c。
Exercise 4. 这里需要对C语言的指针非常熟悉。最好的C语言的引用书籍就是《The C Programming Language》。boot/main.c的时候。obj/kern/kernel内核映像是一个ELF格式的。 "Executable and Linkable Format"。
关于ELF有如下完整的信息。 the ELF specification on our reference page, 但是实际上你是没有必要仔细从头到尾地看这个文档。里面有很多复杂的部分是关于动态链接库的支持的。
对于6.828这门课来说,只需要解的是ELF执行格式里面有个头,里面包含了各种每个程序段的加载信息。通过这些加载信息可以把整个程序正确地加载到内存里面。boot loader并不会去修正里面指针的指向。只是把磁盘上的kernel映像加开到内存里面,然后开始执行之。
ELF程序文是由一个固定长度的ELF头开始的。紧接着的是一个动态可变的程序头list。每个程序头,指明了每个程序段需要被加载的位置,长度,相对于整个程序的偏移量。
注意:相对的是整个程序头的偏移量,而不是相对于磁盘头的偏移量
由于在编译完成之后,才会把kernel写入磁盘的某个扇区。在编译的时候是无法知道会被写入到哪个扇区的。所以编译的时候只能说把相对的位置写入到ELF里面。
.text: The program's executable instructions.
.rodata: Read-only data, such as ASCII string constants produced by the C compiler. (We will not bother setting up the hardware to prohibit writing, however.)
.data: The data section holds the program's initialized data, such as global variables declared with initializers like int x = 5;.
当链接器在计算内存部局的时候,也会保留足够的空间给各种未初始化的全局变量(初始化为0)。一般而言这个空间被称之为.bss段。obj/kern/kernel里面的names, sizes, 以及各种链接地址。
$ objdump -h obj/kern/kernel
obj/kern/kernel: file format elf32-i386
Sections:
Idx Name Size VMA LMA File off Algn
0 .text 00001917 f0100000 00100000 00001000 2**4
CONTENTS, ALLOC, LOAD, READONLY, CODE
1 .rodata 00000714 f0101920 00101920 00002920 2**5
CONTENTS, ALLOC, LOAD, READONLY, DATA
2 .stab 00003889 f0102034 00102034 00003034 2**2
CONTENTS, ALLOC, LOAD, READONLY, DATA
3 .stabstr 000018af f01058bd 001058bd 000068bd 2**0
CONTENTS, ALLOC, LOAD, READONLY, DATA
4 .data 0000a300 f0108000 00108000 00009000 2**12
CONTENTS, ALLOC, LOAD, DATA
5 .bss 00000644 f0112300 00112300 00013300 2**5
ALLOC
6 .comment 0000002b 00000000 00000000 00013300 2**0
CONTENTS, READONLY
真正要了解这个文件,需要查看链接设定文件:
通过这个文件可以知道程序被加载的虚拟地址(VMA),物理地址(LMA)分别是如何指定的。也可以通过File off查看相对文件的偏移量。这个File off偏移量是如何指定的?这个非常有意思。刚好在boot/main.c里面就是一开始就读了了8个扇区,也就是0x1000 bytes。
ELF文件格式简图 kernel在编译和链接的时候,其虚拟地址与物理地址是不一样的。在加载的时候,也就相应地需要设置好页表。
但是考虑一下boot loader。在加载的时候,肯定是没有什么页表等着给你用的。BIOS可不会给你设置页表。所以
$ objdump -h obj/boot/boot.out
Sections:
Idx Name Size VMA LMA File off Algn
0 .text 0000017c 00007c00 00007c00 00000074 2**2
CONTENTS, ALLOC, LOAD, CODE
1 .eh_frame 000000b0 00007d7c 00007d7c 000001f0 2**2
CONTENTS, ALLOC, LOAD, READONLY, DATA
2 .stab 000007b0 00000000 00000000 000002a0 2**2
CONTENTS, READONLY, DEBUGGING
3 .stabstr 00000846 00000000 00000000 00000a50 2**0
CONTENTS, READONLY, DEBUGGING
4 .comment 0000002b 00000000 00000000 00001296 2**0
CONTENTS, READONLY
$ objdump -x obj/boot/boot.out
obj/boot/boot.out: file format elf32-i386
obj/boot/boot.out
architecture: i386, flags 0x00000012:
EXEC_P, HAS_SYMS
start address 0x00007c00
Program Header:
LOAD off 0x00000074 vaddr 0x00007c00 paddr 0x00007c00 align 2**2
filesz 0x0000022c memsz 0x0000022c flags rwx
STACK off 0x00000000 vaddr 0x00000000 paddr 0x00000000 align 2**4
filesz 0x00000000 memsz 0x00000000 flags rwx
Sections:
Idx Name Size VMA LMA File off Algn
0 .text 0000017c 00007c00 00007c00 00000074 2**2
CONTENTS, ALLOC, LOAD, CODE
1 .eh_frame 000000b0 00007d7c 00007d7c 000001f0 2**2
CONTENTS, ALLOC, LOAD, READONLY, DATA
2 .stab 000007b0 00000000 00000000 000002a0 2**2
CONTENTS, READONLY, DEBUGGING
3 .stabstr 00000846 00000000 00000000 00000a50 2**0
CONTENTS, READONLY, DEBUGGING
4 .comment 0000002b 00000000 00000000 00001296 2**0
CONTENTS, READONLY
SYMBOL TABLE:
00007c00 l d .text 00000000 .text
00007d7c l d .eh_frame 00000000 .eh_frame
00000000 l d .stab 00000000 .stab
00000000 l d .stabstr 00000000 .stabstr
00000000 l d .comment 00000000 .comment
00000000 l df *ABS* 00000000 obj/boot/boot.o
00000008 l *ABS* 00000000 PROT_MODE_CSEG
00000010 l *ABS* 00000000 PROT_MODE_DSEG
00000001 l *ABS* 00000000 CR0_PE_ON
00007c0a l .text 00000000 seta20.1
00007c14 l .text 00000000 seta20.2
00007c64 l .text 00000000 gdtdesc
00007c32 l .text 00000000 protcseg
00007c4a l .text 00000000 spin
00007c4c l .text 00000000 gdt
00000000 l df *ABS* 00000000 main.c
00000000 l df *ABS* 00000000
00007c6a g F .text 00000012 waitdisk
00007d0a g F .text 00000072 bootmain
00007cd 1 g F .text 00000039 readseg
00007e2c g .eh_frame 00000000 __bss_start
00007c7c g F .text 00000055 readsect
00007e2c g .eh_frame 00000000 _edata
00007e2c g .eh_frame 00000000 _end
00007c00 g .text 00000000 start
为什么说只有text段是被使用到的呢?
boot/Makefrag
$(OBJDIR)/boot/boot: $(BOOT_OBJS)
@echo + ld boot/boot
$(V)$(LD) $(LDFLAGS) -N -e start -Ttext 0x7C00 -o $@ .out $^
$(V)$(OBJDUMP) -S $@ .out >$@ .asm
$(V)$(OBJCOPY) -S -O binary -j .text $@ .out $@
$(V)perl boot/sign.pl $(OBJDIR)/boot/boot
boot loader自己是没有利用ELF格式的。需要用boot sector固定的格式。不过加载的时候,却是采用了ELF格式来加载内核。
$ objdump -x obj/kern/kernel
obj/kern/kernel: file format elf32-i386
obj/kern/kernel
architecture: i386, flags 0x00000112:
EXEC_P, HAS_SYMS, D_PAGED
start address 0x0010000c
Program Header:
LOAD off 0x00001000 vaddr 0xf0100000 paddr 0x00100000 align 2**12
filesz 0x0000716c memsz 0x0000716c flags r-x
LOAD off 0x00009000 vaddr 0xf0108000 paddr 0x00108000 align 2**12
filesz 0x0000a300 memsz 0x0000a944 flags rw-
STACK off 0x00000000 vaddr 0x00000000 paddr 0x00000000 align 2**4
filesz 0x00000000 memsz 0x00000000 flags rwx
Sections:
Idx Name Size VMA LMA File off Algn
0 .text 00001917 f0100000 00100000 00001000 2**4
CONTENTS, ALLOC, LOAD, READONLY, CODE
1 .rodata 00000714 f0101920 00101920 00002920 2**5
CONTENTS, ALLOC, LOAD, READONLY, DATA
2 .stab 00003889 f0102034 00102034 00003034 2**2
CONTENTS, ALLOC, LOAD, READONLY, DATA
3 .stabstr 000018af f01058bd 001058bd 000068bd 2**0
CONTENTS, ALLOC, LOAD, READONLY, DATA
4 .data 0000a300 f0108000 00108000 00009000 2**12
CONTENTS, ALLOC, LOAD, DATA
5 .bss 00000644 f0112300 00112300 00013300 2**5
ALLOC
6 .comment 0000002b 00000000 00000000 00013300 2**0
CONTENTS, READONLY
SYMBOL TABLE:
f0100000 l d .text 00000000 .text
f0101920 l d .rodata 00000000 .rodata
f0102034 l d .stab 00000000 .stab
f01058bd l d .stabstr 00000000 .stabstr
f0108000 l d .data 00000000 .data
f0112300 l d .bss 00000000 .bss
00000000 l d .comment 00000000 .comment
00000000 l df *ABS* 00000000 obj/kern/entry.o
f010002f l .text 00000000 relocated
f010003e l .text 00000000 spin
00000000 l df *ABS* 00000000 entrypgdir.c
00000000 l df *ABS* 00000000 init.c
00000000 l df *ABS* 00000000 console.c
f01001a0 l F .text 0000001c serial_proc_data
f01001bc l F .text 00000044 cons_intr
f0112320 l O .bss 00000208 cons
f0100200 l F .text 00000117 kbd_proc_data
f0112300 l O .bss 00000004 shift.1330
f0101b00 l O .rodata 00000100 shiftcode
f0101a00 l O .rodata 00000100 togglecode
f01019e0 l O .rodata 00000010 charcode
f0100317 l F .text 000001e0 cons_putc
f0112528 l O .bss 00000002 crt_pos
f011252c l O .bss 00000004 crt_buf
f0112530 l O .bss 00000004 addr_6845
f0112534 l O .bss 00000001 serial_exists
f0112200 l O .data 00000100 normalmap
f0112100 l O .data 00000100 shiftmap
f0112000 l O .data 00000100 ctlmap
00000000 l df *ABS* 00000000 monitor.c
f0101de4 l O .rodata 00000018 commands
00000000 l df *ABS* 00000000 printf.c
f01008eb l F .text 00000013 putch
00000000 l df *ABS* 00000000 kdebug.c
f010094b l F .text 000000dd stab_binsearch
00000000 l df *ABS* 00000000 printfmt.c
f0100c10 l F .text 000000ef printnum
f0100cff l F .text 0000001d sprintputch
f0102008 l O .rodata 0000001c error_string
00000000 l df *ABS* 00000000 readline.c
f0112540 l O .bss 00000400 buf
00000000 l df *ABS* 00000000 string.c
00000000 l df *ABS* 00000000
f010000c g .text 00000000 entry
f0101337 g F .text 00000020 strcpy
f0100513 g F .text 00000012 kbd_intr
f010079f g F .text 0000000a mon_backtrace
f01000f8 g F .text 0000005f _panic
f010009d g F .text 0000005b i386_init
f01014d4 g F .text 00000068 memmove
f0101208 g F .text 00000028 snprintf
f0100d44 g F .text 0000046c vprintfmt
f0100525 g F .text 0000004a cons_getc
f0100931 g F .text 0000001a cprintf
f010153c g F .text 00000021 memcpy
f0101230 g F .text 000000ca readline
f0111000 g O .data 00001000 entry_pgtable
f0100040 g F .text 0000005d test_backtrace
f01011b0 g F .text 00000058 vsnprintf
f0112300 g .data 00000000 edata
f010056f g F .text 000000f2 cons_init
f01058bc g .stab 00000000 __STAB_END__
f01058bd g .stabstr 00000000 __STABSTR_BEGIN__
f01017c0 g F .text 00000157 .hidden __umoddi3
f01004f7 g F .text 0000001c serial_intr
f0101690 g F .text 00000124 .hidden __udivdi3
f0100682 g F .text 0000000a iscons
f01015b3 g F .text 000000d3 strtol
f0101318 g F .text 0000001f strnlen
f0101357 g F .text 0000002b strcat
f0112940 g O .bss 00000004 panicstr
f0112944 g .bss 00000000 end
f0100157 g F .text 00000045 _warn
f010146b g F .text 0000001c strfind
f0101917 g .text 00000000 etext
0010000c g .text 00000000 _start
f01013af g F .text 0000003d strlcpy
f0101412 g F .text 00000038 strncmp
f0101382 g F .text 0000002d strncpy
f010155d g F .text 00000039 memcmp
f0100661 g F .text 00000010 cputchar
f0101487 g F .text 0000004d memset
f0100671 g F .text 00000011 getchar
f0100d1c g F .text 00000028 printfmt
f010716b g .stabstr 00000000 __STABSTR_END__
f01013ec g F .text 00000026 strcmp
f0100a28 g F .text 000001d9 debuginfo_eip
f01008fe g F .text 00000033 vcprintf
f0110000 g .data 00000000 bootstacktop
f0110000 g O .data 00001000 entry_pgdir
f0108000 g .data 00000000 bootstack
f0102034 g .stab 00000000 __STAB_BEGIN__
f0101300 g F .text 00000018 strlen
f010144a g F .text 00000021 strchr
f01006d5 g F .text 000000ca mon_kerninfo
f01007a9 g F .text 00000142 monitor
f0101596 g F .text 0000001d memfind
f0100690 g F .text 00000045 mon_help
因此,这里可以看出来。program headers 就是写在ELF头里面给加载程序用的。但是这里主要关注:
vaddr 加载后程序内部引用的各种虚拟地址基地址
paddr 加载到的物理基地址
memsz 这个程序段的大小
filesz 这个程序段所在位置起始位置。注意,这里是相对于文件头而言。 !!
这么四个变量。使用-x 输出太长了。虽然里面有些信息lab2会用到。不过对于lab1而言。只需要如下命令就可以理解了。
$ objdump -p obj/kern/kernel
obj/kern/kernel: file format elf32-i386
Program Header:
LOAD off 0x00001000 vaddr 0xf0100000 paddr 0x00100000 align 2**12
filesz 0x0000716c memsz 0x0000716c flags r-x
LOAD off 0x00009000 vaddr 0xf0108000 paddr 0x00108000 align 2**12
filesz 0x0000a300 memsz 0x0000a944 flags rw-
STACK off 0x00000000 vaddr 0x00000000 paddr 0x00000000 align 2**4
filesz 0x00000000 memsz 0x00000000 flags rwx
Exercise 5. 这里比较有意的是试一下修改boot/Makefrag文件中的-Ttext里面的起始地址。如果修改了起始地址。
mov ax, bx
mov cx, ax
mov dx, ax
这样的操作是不会出错的。随便改了加载地址,也可以随意进行加载。都可以work。
jmp jump_addr
addr_tag:
.db varname 0
jump_addr:
任何引用到addr_tag和jump_addr这两个地址的地方都会出错。所以一旦不对应之后。运行必然出错。boot loader则是不一样的。
Exercise 6. 接下来需要利用GDB的x命令查看内存中的指令。 GDB manual 有各种详细的细节。
What is there at the second breakpoint? (You do not really need to use QEMU to answer this question. Just think.)
# The Multiboot header
.align 4
.long MULTIBOOT_HEADER_MAGIC
.long MULTIBOOT_HEADER_FLAGS
.long CHECKSUM
# '_start' specifies the ELF entry point. Since we haven't set up
# virtual memory when the bootloader enters this code, we need the
# bootloader to jump to the *physical* address of the entry point.
.globl _start
_start = RELOC(entry)
.globl entry
entry:
movw $0x1234,0x472 # warm boot
kernel的开头就是entry.S。
(gdb) x/8x 0x100000
0x100000: 0x1badb002 0x00000000 0xe4524ffe 0x7205c766
0x100010: 0x34000004 0x0000b812 0x220f0011 0xc0200fd8
开头的三个值刚好是
#define MULTIBOOT_HEADER_MAGIC (0x1BADB002)
#define MULTIBOOT_HEADER_FLAGS (0)
#define CHECKSUM (-(MULTIBOOT_HEADER_MAGIC + MULTIBOOT_HEADER_FLAGS))
Exercise 7 1. Use QEMU and GDB to trace into the JOS kernel and stop at the movl %eax, %cr0. Examine memory at 0x00100000 and at 0xf0100000. Now, single step over that instruction using the stepi GDB command. Again, examine memory at 0x00100000 and at 0xf0100000. Make sure you understand what just happened.
Q:用Qemu和GDB跳到JOS的内核里面。并且暂停在movl %eax, %cr0这条指令这里。验证内存两个地址:0x00100000 and at 0xf0100000。接下来用s指令一条一条地执行。然后再验证一下这个两个内存地址的内容。确保你理解整个发生的过程。
首先需要明白:程序地址与寻址地址
如果支持的寻址地址不支持汇编里面的地址(比如页表没有建立起来)。比如:
这个时候必须要知道0xf0100000真正的物理地址是什么。程序代码里直接成相应的物理地址。
#define RELOC(x) ((x) - KERNBASE)
示例1: kernel的入口地址
# '_start' specifies the ELF entry point. Since we haven't set up
# virtual memory when the bootloader enters this code, we need the
# bootloader to jump to the *physical* address of the entry point.
.globl _start
_start = RELOC(entry)
.globl entry
entry:
kernel在编译的时候是并不知道会被加载到哪里的。通过链接的时候kern/kernel.ld链接脚本可以指令被加载到的物理地址。但是程序的入口地址仍然需要告知ELF。_start是入口。如果不加任何处理,那么_start就是一个虚拟地址。这个值会反应在ELF header->e_entry值上面。(看boot/main.c)里面的跳转到内核的代码:
// call the entry point from the ELF header
// note: does not return!
((void (*)(void)) (ELFHDR->e_entry))();
这里面e_entry就指向_start值。由于从boot loader跳转到的内核的时候,还在物理地址与虚拟地址完全重合的情况。并且也没有开启分页。所以这个时候必须在kern/entry.S里面
.globl _start
_start = RELOC(entry)
把_start地址改造成物理地址。这会儿,
root@debug:~/6.828/lab
obj/kern/kernel: file format elf32-i386
architecture: i386, flags 0x00000112:
EXEC_P, HAS_SYMS, D_PAGED
start address 0x0010000c
这个时候start address就是一个物理地址。
原问题的正解
首先对entry.S代码加以注释。
# Load the physical address of entry_pgdir into cr3. entry_pgdir
# is defined in entrypgdir.c.
这里把页表加载到cr3寄存器。注意加载的时候,这里是直接用的物理地址。
页表还没有打开,当然是不能用到虚拟地址了。
movl $(RELOC(entry_pgdir)), %eax
f0100015: b8 00 00 11 00 mov $0x110000,%eax
movl %eax, %cr3
f010001a: 0f 22 d8 mov %eax,%cr3
# 开启分页模式
# Turn on paging.
movl %cr0, %eax
f010001d: 0f 20 c0 mov %cr0,%eax
orl $(CR0_PE|CR0_PG|CR0_WP), %eax
f0100020: 0d 01 00 01 80 or $0x80010001,%eax
movl %eax, %cr0
f0100025: 0f 22 c0 mov %eax,%cr0
所以原问题中在开启分页前去看0xf0100000地址时。肯定为0。因为在当前地址空间里面,这部分虚拟地址是没有内容的。页表也还没有。只能是假装去访问物理地址。0xf0100000与0x00100000内容就完全一样了。这是因为把[0, 4MB)映射到了[0xf0000000, 0xf0000000 + 4MB)的地方了。
# Now paging is enabled, but we're still running at a low EIP
# (why is this okay?). Jump up above KERNBASE before entering
# C code.
mov $relocated, %eax
jmp *%eax
relocated:
当开启分页之后,立马会进行相应的跳转。这里主要是因为后面会开始执行C语言的函数了。必须设置好相应的CS:IP, esp, ebp, ss等寄存器。如果还是在物理地址空间运行。但是C语言是以为自己在虚拟地址空间运行的。
CPU跑在物理地址空间上,而不是虚拟地址空间上。(尽管CS:IP会被翻译到真正的地址。)
C语言认为是自己是跑在虚拟地址空间。
通过jmp,可以使得两者正常化。CPU在取指,寻址的时候,就会在有页映射的地址空间里面了。环境设置好,就可以开始跳转到C语言里面了。
2. What is the first instruction after the new mapping is established that would fail to work properly if the mapping weren’t in place? Comment out the movl %eax, %cr0 in kern/entry.S, trace into it, and see if you were right.
这个问题其实也比较扯的。主要意思是说,如果把movl %eax, %cr0删除掉会发生什么样的情况。
# movl %eax, %cr0
# Now paging is enabled, but we're still running at a low EIP
# (why is this okay?). Jump up above KERNBASE before entering
# C code.
mov $relocated, %eax
jmp *%eax
relocated:
# Clear the frame pointer register (EBP)
# so that once we get into debugging C code,
# stack backtraces will be terminated properly.
movl $0x0,%ebp # nuke frame pointer
# Set the stack pointer
movl $(bootstacktop),%esp
那么在movl $(bootstacktop), %esp这里就立马出错了。
因为把$bootstacktop当成物理地址了。但是实际上,哪有那么大的物理地址空间。所以肯定会报错了。(万一真给了qemu那么大的物理地址空间,那边物理地址也没有内容,跳到C语言之后就会出错。)
Exercise 8 We have omitted a small fragment of code - the code necessary to print octal numbers using patterns of the form “%o”. Find and fill in this code fragment.
这里的意思是说,去修改程序,使得程序能够正确地输出%o。这里还是比较简单的,只需要参考一下%d的输出代码。
root@debug:~/6.828 /lab# git diff
diff --git a/lib/printfmt.c b/lib/printfmt.c
index 28e01 c9..1 d3a5fa 100644
--- a/lib/printfmt.c
+++ b/lib/printfmt.c
@@ -206 ,10 +206 ,13 @@ vprintfmt(void (*putch)(int , void *), void *putdat, const char *fmt, va_list ap)
case 'o' :
- putch('X' , putdat);
- putch('X' , putdat);
- putch('X' , putdat);
- break ;
+ num = getint(&ap, lflag);
+ if ((long long ) num < 0 ) {
+ putch('-' , putdat);
+ num = -(long long ) num;
+ }
+ base = 8 ;
+ goto number;
case 'p' :
然后运行
$ make
$ make qemu-nox
6828 decimal is 15254 octal!
就会看到相应的输出了。
Explain the interface between printf.c and console.c. Specifically, what function does console.c export? How is this function used by printf.c?
console.c与printf.c里面有什么样的接口?
cprintf -> vcprintf -> vprintfmt -> putch -> cputchar
然后cputchar的声明是在./inc/stdio.h:11 :void cputchar (int c)
这个函数的定义是在console.c
void cputchar (int c)
{
cons_putc(c);
}
static void
cons_putc (int c)
{
serial_putc(c);
lpt_putc(c);
cga_putc(c);
}
接下主要就是看cga_putc。也就是显示到屏幕上的函数。首先看一下cga_init。这个函数的功能就是选定特定的屏幕。比如vga, cga等。
static void cga_init (void )
{
volatile uint16_t *cp;
uint16_t was;
unsigned pos;
cp = (uint16_t *) (KERNBASE + CGA_BUF);
was = *cp;
*cp = (uint16_t ) 0xA55A ;
if (*cp != 0xA55A ) {
cp = (uint16_t *) (KERNBASE + MONO_BUF);
addr_6845 = MONO_BASE;
} else {
*cp = was;
addr_6845 = CGA_BASE;
}
outb(addr_6845, 14 );
pos = inb(addr_6845 + 1 ) << 8 ;
outb(addr_6845, 15 );
pos |= inb(addr_6845 + 1 );
crt_buf = (uint16_t *) cp;
crt_pos = pos;
}
一般而言,显示操作的时候,启动的时候,都是使用提CGA。也就是
./kern/console.h:14 :#define CGA_BUF 0xB8000
初始化的时候,需要设定光标的位置。设置完成之后。就可以利用cga_putc来CGA屏幕上显示字符了。这里可以看出来,除了各个字符的设定之外。还随时移动的光标。
static void cga_putc (int c)
{
if (!(c & ~0xFF ))
c |= 0x0700 ;
switch (c & 0xff ) {
case '\b' :
if (crt_pos > 0 ) {
crt_pos--;
crt_buf[crt_pos] = (c & ~0xff ) | ' ' ;
}
break ;
case '\n' :
crt_pos += CRT_COLS;
case '\r' :
crt_pos -= (crt_pos % CRT_COLS);
break ;
case '\t' :
cons_putc(' ' );
cons_putc(' ' );
cons_putc(' ' );
cons_putc(' ' );
cons_putc(' ' );
break ;
default :
crt_buf[crt_pos++] = c;
break ;
}
if (crt_pos >= CRT_SIZE) {
int i;
memmove(crt_buf, crt_buf + CRT_COLS, (CRT_SIZE - CRT_COLS) * sizeof (uint16_t ));
for (i = CRT_SIZE - CRT_COLS; i < CRT_SIZE; i++)
crt_buf[i] = 0x0700 | ' ' ;
crt_pos -= CRT_COLS;
}
outb(addr_6845, 14 );
outb(addr_6845 + 1 , crt_pos >> 8 );
outb(addr_6845, 15 );
outb(addr_6845 + 1 , crt_pos);
}
Explain the following from console.c:
这段代码的作用就是在当写满一个屏幕的时候,把整个字符串往上滚动一行。
if (crt_pos >= CRT_SIZE) {
int i;
memmove(crt_buf, crt_buf + CRT_COLS, (CRT_SIZE - CRT_COLS) * sizeof (uint16_t ));
for (i = CRT_SIZE - CRT_COLS; i < CRT_SIZE; i++)
crt_buf[i] = 0x0700 | ' ' ;
crt_pos -= CRT_COLS;
}
For the following questions you might wish to consult the notes for Lecture 2. These notes cover GCC’s calling convention on the x86.
单步执行以下代码。然后回答以下问题:
int x = 1 , y = 3 , z = 4 ;
cprintf("x %d, y %x, z %d\n" , x, y, z);
In the call to cprintf(), to what does fmt point? To what does ap point?
List (in order of execution) each call to cons_putc, va_arg, and vcprintf. For cons_putc, list its argument as well. For va_arg, list what ap points to before and after the call. For vcprintf list the values of its two arguments.
单步执行其实没有太多的必要。仔细读一下cprintf函数代码实现就可以了。
static void
putch (int ch, int *cnt)
{
cputchar(ch);
*cnt++;
}
int
vcprintf (const char *fmt, va_list ap)
{
int cnt = 0 ;
vprintfmt((void *)putch, &cnt, fmt, ap);
return cnt;
}
int
cprintf (const char *fmt, ...)
{
va_list ap;
int cnt;
va_start(ap, fmt);
cnt = vcprintf(fmt, ap);
va_end(ap);
return cnt;
}
这里面va_list的宏:
typedef __b uiltin_va_list va_list;
#define va_start(ap, last) __builtin_va_start(ap, last)
#define va_arg(ap, type) __builtin_va_arg(ap, type)
#define va_end(ap) __builtin_va_end(ap)
结果发现这几个宏都是由GCC来提供了。嗯。这样实际上是不太容易能够分析清楚的。mit 6.828 2007版本的代码。
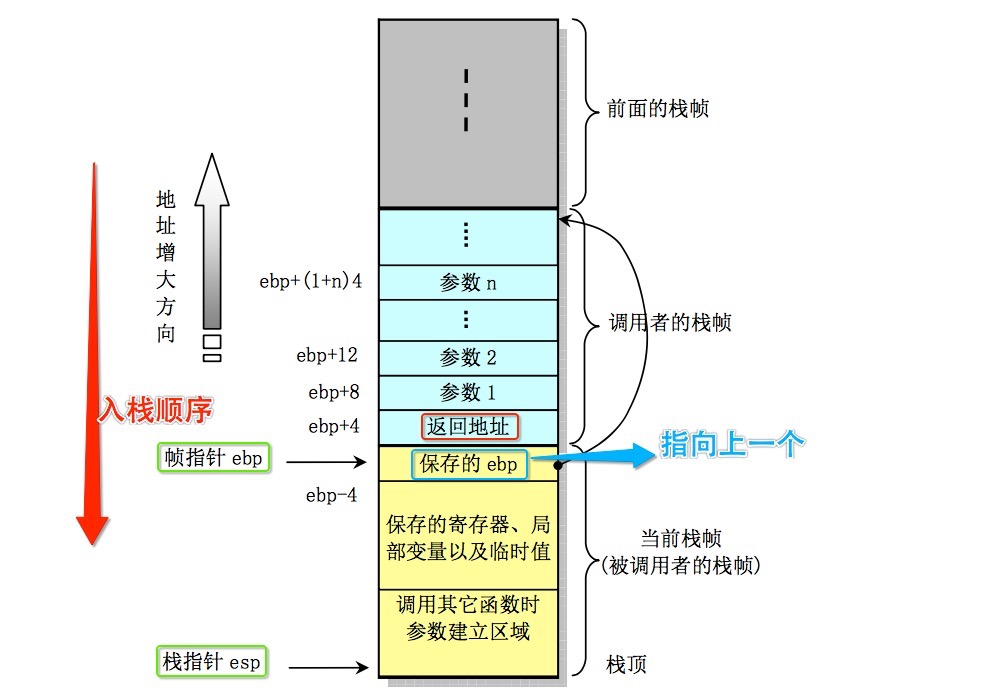
在读下面的代码的时候,一定要注意栈的方向是从高地址往低地址前进。并且压栈的时候,
typedef char *va_list;
#define __va_size(type) \
(((sizeof(type) + sizeof(long) - 1) / sizeof(long)) * sizeof(long))
#define va_start(ap, last) \
((ap) = (va_list)&(last) + __va_size(last))
#define va_arg(ap, type) \
(*(type *)((ap) += __va_size(type), (ap) - __va_size(type)))
#define va_end(ap) ((void)0)
所以这里回到原来的代码:
int x = 1 , y = 3 , z = 4 ;
cprintf("x %d, y %x, z %d\n" , x, y, z);
fmt就是指向那个const char *的字符串。当调用的时候,栈中的结构是如下:
+-----------------+
| |
| Z |
| |
| |
+-----------------+
| |
| Y |
| |
| |
+-----------------+
| |
| X |
| |
| |
+-----------------+
| |
| fmt |
| |
| |
+-----------------+ <-----------+&fmt
va_start(fmt, ap) 作用如下
#define va_start(ap, last) \
((ap) = (va_list)&(last) + __va_size(last))
展开就是
ap = (char *)(&fmt) + align_long(fmt);
+-----------------+
| |
| Z |
| |
| |
+-----------------+
| |
| Y |
| |
| |
+-----------------+
| |
| X |
| |
| |
+-----------------+ <--------------+ap
| |
| fmt |
| |
| |
+-----------------+
接下来简单一点,看一下调用到%c输出的时候,代码是怎么走的
void
vprintfmt(void (*putch)(int, void*), void *putdat, const char *fmt, va_list ap)
{
while (1) {
// 如果只是一般的字符串,直接输出。
while ((ch = *(unsigned char *) fmt++) != '%') {
if (ch == '\0')
return;
putch(ch, putdat);
}
// 如果发现是%c
reswitch:
// 先把%号跳掉,取出'c'
switch (ch = *(unsigned char *) fmt++) {
// ..
case 'c':
putch(va_arg(ap, int), putdat);
break;
}
}
}
这个时候通过%c就知道应该从栈中取出一个参数char类型。
va_arg(ap, int ) 展开后就是
#define va_arg(ap, type) \
(*(type *)((ap) += __va_size(type), (ap) - __va_size(type)))
char temp = *(char *)ap;
putch(temp, putdat);
ap += align_long(char );
执行完成之后。
+-----------------+
| |
| Z |
| |
| |
+-----------------+
| |
| Y |
| |
| |
+-----------------+ <------+ap
| |
| X | 这个x会被%d提出来进行输出。
| |
| |
+-----------------+
| |
| fmt |
| |
| |
+-----------------+
从这里也可以总结出来。ap的作用实际上就是利用fmt里面的%依次把后面的类型提出来。
问题4 运行如下代码会输出什么?
unsigned int i = 0x00646c72;
cprintf("H%x Wo%s", 57616, &i);
输出是什么?解释一下?
首先%x是输出16进制。
57616 = 0xE110 。
i = 0x00646c72
那么如果把i占用的4b yte转换成为char [4 ]数组。结果就是:
char str[4 ] = {0x72 , 0x6c , 0x64 , 0x00 };
所以输出就是
Hell0 World
问题5
y后面会输出啥?这种栈越界操作,其实是无法判定的。因为不知道越界这个内存里面以前放的内容是什么。
问题
GCC里面输出的时候,入栈的顺序是从函数调用方的右往左入栈。所以,最后一个参数最先入栈。第一个栈入最后入栈。
其实也还是可以拿到参数的。只不过需要把宏的加减法改一下就可以了。把这里的加法改成减法,减法改成加法。
typedef char *va_list;
#define __va_size(type) \
(((sizeof(type) + sizeof(long) - 1) / sizeof(long)) * sizeof(long))
#define va_start(ap, last) \
((ap) = (va_list)&(last) + __va_size(last))
#define va_arg(ap, type) \
(*(type *)((ap) += __va_size(type), (ap) - __va_size(type)))
#define va_end(ap) ((void)0)
挑战 输出各种颜色。这种事情好玩,但是与操作系统核心偏得有点远。这里不去关注。
Exercise 9. Determine where the kernel initializes its stack, and exactly where in memory its stack is located. How does the kernel reserve space for its stack? And at which “end” of this reserved area is the stack pointer initialized to point to?
内核在哪里初始化了内核用到的栈?
// 首先boot.S里面初始化了ss段描述符。
# Set up the protected-mode data segment registers
movw $PROT_MODE_DSEG, %ax # Our data segment selector
movw %ax, %ds # -> DS: Data Segment
movw %ax, %es # -> ES: Extra Segment
movw %ax, %fs # -> FS
movw %ax, %gs # -> GS
movw %ax, %ss # -> SS: Stack Segment
# Set up the stack pointer and call into C.
movl $start, %esp
call bootmain
// 然后再进入到kern/entry.S。
// 有意思的是,这里是把栈顶设置为0。后面在递归回溯的时候,遇到放ebp = 0的时候,应该停止了。
// 在后面的作业里会用到这个。
//
# Clear the frame pointer register (EBP)
# so that once we get into debugging C code,
# stack backtraces will be terminated properly.
movl $0x0,%ebp # nuke frame pointer
# Set the stack pointer
movl $(bootstacktop),%esp
# now to C code
call i386_init
...
###################################################################
# boot stack
###################################################################
.p2align PGSHIFT # force page alignment
.globl bootstack
bootstack:
.space KSTKSIZE
.globl bootstacktop
bootstacktop:
这里可以看一下内核的内存分配图。
* Virtual memory map: Permissions
* kernel/user
*
* 4 Gig --------> +------------------------------+
* | | RW/--
* ~~~~~~~~~~~~~~~~~~~~~~~~~~~~~~~~
* : . :
* : . :
* : . :
* |~~~~~~~~~~~~~~~~~~~~~~~~~~~~~~| RW/--
* | | RW/--
* | Remapped Physical Memory | RW/--
* | | RW/--
* KERNBASE, ----> +------------------------------+ 0xf0000000 --+
* KSTACKTOP | CPU0's Kernel Stack | RW/-- KSTKSIZE |
* | - - - - - - - - - - - - - - -| |
* | Invalid Memory (*) | --/-- KSTKGAP |
* +------------------------------+ |
* | CPU1's Kernel Stack | RW/-- KSTKSIZE |
* | - - - - - - - - - - - - - - -| PTSIZE
* | Invalid Memory (*) | --/-- KSTKGAP |
* +------------------------------+ |
* : . : |
* : . : |
* MMIOLIM ------> +------------------------------+ 0xefc00000 --+
./inc/memlayout.h:97:#define KSTKSIZE (8*PGSIZE) // size of a kernel stack
可以看出来。kernel就是把内核栈放到了kernel代码的后面。大小就是一个KSTKSIZE。
Exercise 10. 为了熟悉C函数调用的转换。可以在obj/kern/kernel.asm中找到test_backtrace函数。在那里设置一个断点。
void
test_backtrace (int x)
{
cprintf("entering test_backtrace %d\n" , x);
if (x > 0 )
test_backtrace(x-1 );
else
mon_backtrace(0 , 0 , 0 );
cprintf("leaving test_backtrace %d\n" , x);
}
调用方进行的操作如下:
将参数由右向左压入栈
将返回地址 (eip中的内容) 入栈,在 call 指令执行
函数内部执行:
f0100040: 55 push %ebp
f0100041: 89 e5 mov %esp,%ebp
f0100043: 53 push %ebx
f0100044: 83 ec 14 sub $0x14,%esp
将上一个函数的 ebp 入栈
将 ebx 入栈,保护寄存器状态
在栈上开辟一个空间存储局部变量。这里会有5个int的空间。
整理过程如下:
./kern/init.c:39: test_backtrace(5);
主函数的调用 x = 5
1. move $0x5 , (%esp) ;执行的是movl $0x05 , %(esp); 执行完之后。此时esp = 0xf010ffe0. ebp = 0xf010fff8
2. push f01000ea(retaddr) ;这是压入test_backtrace(5);返回之后的地址。执行完之后 esp = 0xf010ffe0 - 4;
3. push %ebp ;压入0xf010fff8. 执行完之后。esp = 0xf010ffe0 - 8;
movl %esp, %ebp ;执行完之后ebp = esp = 0xf010ffe0 - 8 = 0xf010ffd8
4. push %ebx ;不管这里%ebx是多少。总之esp = 0xf010ffd8 - 4 = 0xf010ffd4
5. subl $0x14 , %esp ;esp = 0xf010ffd4 - 0x14 = 0xf010ffc0
(gdb) x/64x $esp
0xf010ff20: 0xf01019a0 0x00000000 0xf010ff58 0x00000000
0xf010ff30: 0xf01008eb 0x00000001 0xf010ff58 0xf0100069
0xf010ff40: 0x00000000 0x00000001 0xf010ff78 0x00000000
0xf010ff50: 0xf01008eb 0x00000002 0xf010ff78 0xf0100069
0xf010ff60: 0x00000001 0x00000002 0xf010ff98 0x00000000
0xf010ff70: 0xf01008eb 0x00000003 0xf010ff98 0xf0100069
0xf010ff80: 0x00000002 0x00000003 0xf010ffb8 0x00000000
0xf010ff90: 0xf01008eb 0x00000004 0xf010ffb8 0xf0100069
0xf010ffa0: 0x00000003 0x00000004 0x00000000 0x00000000
0xf010ffb0: 0x00000000 0x00000005 0xf010ffd8 0xf0100069
0xf010ffc0: 5.esp_0x00000004 0x00000005 0x00000000 0x00010094
0xf010ffd0: 0x00010094 4.0x00010094 3.0xf010fff8 2.0xf01000ea (返回地址)
0xf010ffe0: 1.0x00000005 0x00001aac 0x00000644 0x00000000
0xf010fff0: 0x00000000 0x00000000 0x00000000 0xf010003e
接着开始第二轮,也就是真正的递归。
接着开始第二轮 x == 4
在函数递归调用的时候,是这么调用的。
f010005e: 8d 43 ff lea -0x1(%ebx),%eax
f0100061: 89 04 24 mov %eax,(%esp)
f0100064: e8 d7 ff ff ff call f0100040 <test_backtrace>
1. mov %eax,(%esp) ; 执行完成之后. esp = 0xf010ffc0,这里eax也就是等于x-1。也就是4
2. push f0100069 (retaddr) ; 执行完成之后,esp = 0xf010ffbc
3. push 0xf010ffd8 (%ebp) ; 执行完成之后,esp = 0xf010ffb8
movl %esp, %ebp ; 执行完成之后, esp = ebp = 0xf010ffb8
4. push %ebx ; 执行完成之后, esp = 0xf010ffb4
5. subl $0x14 , %esp ; 执行完成之后, esp = 0xf010ffa0
(gdb) x/64x $esp
0xf010ff20: 0xf01019a0 0x00000000 0xf010ff58 0x00000000
0xf010ff30: 0xf01008eb 0x00000001 0xf010ff58 0xf0100069
0xf010ff40: 0x00000000 0x00000001 0xf010ff78 0x00000000
0xf010ff50: 0xf01008eb 0x00000002 0xf010ff78 0xf0100069
0xf010ff60: 0x00000001 0x00000002 0xf010ff98 0x00000000
0xf010ff70: 0xf01008eb 0x00000003 0xf010ff98 0xf0100069
0xf010ff80: 0x00000002 0x00000003 0xf010ffb8 0x00000000
0xf010ff90: 0xf01008eb 0x00000004 0xf010ffb8 0xf0100069
0xf010ffa0: 5.0x00000003 0x00000004 0x00000000 0x00000000
0xf010ffb0: 0x00000000 4.0x00000005 3.0xf010ffd8 2.0xf0100069
0xf010ffc0: 1.esp_0x00000004 0x00000005 0x00000000 0x00010094
0xf010ffd0: 0x00010094 4.0x00010094 3.0xf010fff8 2.0xf01000ea (返回地址)
0xf010ffe0: 1.0x00000005 0x00001aac 0x00000644 0x00000000
0xf010fff0: 0x00000000 0x00000000 0x00000000 0xf010003e
然后开始第三轮,也就是把x=3开始调用。
接着开始第二轮 x == 3
在函数递归调用的时候,是这么调用的。
f010005e: 8d 43 ff lea -0x1(%ebx),%eax
f0100061: 89 04 24 mov %eax,(%esp)
f0100064: e8 d7 ff ff ff call f0100040 <test_backtrace>
1. mov %eax,(%esp) ; 执行完成之后. esp = 0xf010ffa0,这里eax也就是等于x-1。也就是3
2. push f0100069 (retaddr) ; 执行完成之后,esp = 0xf010ff9c
3. push 0xf010ffd8 (%ebp) ; 执行完成之后,esp = 0xf010ff98
movl %esp, %ebp ; 执行完成之后, esp = ebp = 0xf010ff98
4. push %ebx ; 执行完成之后, esp = 0xf010ff94
5. subl $0x14 , %esp ; 执行完成之后, esp = 0xf010ff80
(gdb) x/64x $esp
0xf010ff20: 0xf01019a0 0x00000000 0xf010ff58 0x00000000
0xf010ff30: 0xf01008eb 0x00000001 0xf010ff58 0xf0100069
0xf010ff40: 0x00000000 0x00000001 0xf010ff78 0x00000000
0xf010ff50: 0xf01008eb 0x00000002 0xf010ff78 0xf0100069
0xf010ff60: 0x00000001 0x00000002 0xf010ff98 0x00000000
0xf010ff70: 0xf01008eb 0x00000003 0xf010ff98 0xf0100069
0xf010ff80: 5.0x00000002 0x00000003 0xf010ffb8 0x00000000
0xf010ff90: 0xf01008eb 0x00000004(ebx) 3. 0xf010ffb8 2.0xf0100069
0xf010ffa0: 1.0x00000003 0x00000004 0x00000000 0x00000000
0xf010ffb0: 0x00000000 4.0x00000005 3.0xf010ffd8 2.0xf0100069
0xf010ffc0: 1.esp_0x00000004 0x00000005 0x00000000 0x00010094
0xf010ffd0: 0x00010094 4.0x00010094 3.0xf010fff8 2.0xf01000ea (返回地址)
0xf010ffe0: 1.0x00000005 0x00001aac 0x00000644 0x00000000
0xf010fff0: 0x00000000 0x00000000 0x00000000 0xf010003e
后面就不用再依次展开,可以把这个过程分为以下几个部分。
(gdb) x/64x $esp
// x == 0的时候
0xf010ff20: 0xf01019a0 0x00000000 0xf010ff58 0x00000000
0xf010ff30: 0xf01008eb 0x00000001 0xf010ff58 0xf0100069
// x == 1
0xf010ff40: 0x00000000 0x00000001 0xf010ff78 0x00000000
0xf010ff50: 0xf01008eb 0x00000002 0xf010ff78 0xf0100069
// x == 2
0xf010ff60: 0x00000001 0x00000002 0xf010ff98 0x00000000
0xf010ff70: 0xf01008eb 0x00000003 0xf010ff98 0xf0100069
// x == 3
0xf010ff80: 0x00000002 0x00000003 0xf010ffb8 0x00000000
0xf010ff90: 0xf01008eb 0x00000004 0xf010ffb8 0xf0100069
// x == 4
0xf010ffa0: 0x00000003 0x00000004 0x00000000 0x00000000
0xf010ffb0: 0x00000000 0x00000005 0xf010ffd8 0xf0100069
// x = 5
0xf010ffc0: 0x00000004 0x00000005 0x00000000 0x00010094
0xf010ffd0: 0x00010094 0x00010094 0xf010fff8 0xf01000ea
0xf010ffe0: 0x00000005 0x00001aac 0x00000644 0x00000000
0xf010fff0: 0x00000000 0x00000000 0x00000000 0xf010003e
注意,看每一个部分的时候,一定要注意:进入函数之后
3. push 0xf010ffd8 (%ebp) ; 执行完成之后,esp = 0xf010ffb8
movl %esp, %ebp ; 执行完成之后, esp = ebp = 0xf010ffb8
4. push %ebx ; 执行完成之后, esp = 0xf010ffb4
5. subl $0x14, %esp ; 执行完成之后, esp = 0xf010ffa0
然后递归调用的时候
f010005e: 8d 43 ff lea -0x1(%ebx),%eax
f0100061: 89 04 24 mov %eax,(%esp)
f0100064: e8 d7 ff ff ff call f0100040 <test_backtrace>
所以。
// x = 5
0xf010ffc0: 0x00000004 0x00000005 0x00000000 0x00010094
0xf010ffd0: 0x00010094 0x00010094 0xf010fff8 0xf01000ea
0xf010ffe0: 0x00000005
这里0xf010ffc0: 0x00000004这个4.实际上是在x = 5的时候,开始往函数里面填写参数的时候生成的。
此外,也需要记住每次%ebp指针的变化图。
Exercise 11. 通过以上的代码操作,给足了信息,已经实现一个栈回溯的程序了mon_backtrace()。这个函数的原型已经等着你去填相应的代码了。kern/monitor.c。但是在操作的时候,必须全部使用C语言。在inc/x86.h里面的read_ebp()函数会是非常有用的。monitor命令的输出。
通过命令可以得到如下的输出。
Stack backtrace:
ebp f0109e58 eip f0100a62 args 00000001 f0109e80 f0109e98 f0100ed2 00000031
ebp f0109ed8 eip f01000d6 args 00000000 00000000 f0100058 f0109f28 00000061
...
每一行都包含了ebp, eip, args。这段小代码还是比较好处理的。
int
mon_backtrace (int argc, char **argv, struct Trapframe *tf)
{
uint32_t ebp = read_ebp();
#define TO_INT(x) *((uint32_t*)(x))
while (ebp) {
cprintf("ebp %08x eip %08x args %08x %08x %08x %08x %08x\n" ,
TO_INT(ebp),
TO_INT((ebp+4 )),
TO_INT((ebp+8 )),
TO_INT((ebp+12 )),
TO_INT((ebp+16 )),
TO_INT((ebp+20 )),
TO_INT((ebp+24 )));
ebp = TO_INT(ebp);
}
return 0 ;
}
代码还是比较简单的。
Exercise 12 修改stack backtrace函数来显示每个eip, fun_name, source_file_name, line_number等与eip相关联系的信息。debuginfo_eip里面,__STAB_*这些信息是从哪里来的呢?这里可以通过以下方式来了解:
look in the file kern/kernel.ld for __STAB_*
run objdump -h obj/kern/kernel
run objdump -G obj/kern/kernel
run gcc -pipe -nostdinc -O2 -fno-builtin -I. -MD -Wall -Wno-format -DJOS_KERNEL -gstabs -c -S kern/init.c, and look at init.s.
链接脚本 .stabstr : {
PROVIDE(__STABSTR_BEGIN__ = .);
*(.stabstr);
PROVIDE(__STABSTR_END__ = .);
BYTE(0) /* Force the linker to allocate space
for this section */
}
比如通过objdump -h obj/kern/kernel:
root@debug:~/6.828/lab# objdump -h obj/kern/kernel
obj/kern/kernel: file format elf32-i386
Sections:
Idx Name Size VMA LMA File off Algn
0 .text 000019d7 f0100000 00100000 00001000 2**4
CONTENTS, ALLOC, LOAD, READONLY, CODE
1 .rodata 0000079c f01019e0 001019e0 000029e0 2**5
CONTENTS, ALLOC, LOAD, READONLY, DATA
2 .stab 00003955 f010217c 0010217c 0000317c 2**2
CONTENTS, ALLOC, LOAD, READONLY, DATA
3 .stabstr 000018ba f0105ad1 00105ad1 00006ad1 2**0
CONTENTS, ALLOC, LOAD, READONLY, DATA
4 .data 0000a300 f0108000 00108000 00009000 2**12
CONTENTS, ALLOC, LOAD, DATA
5 .bss 00000644 f0112300 00112300 00013300 2**5
ALLOC
6 .comment 0000002b 00000000 00000000 00013300 2**0
CONTENTS, READONLY
这里就可以看到.stabstr段。
而objdump -G obj/kern/kernel可以把所有的详细信息都打印出来。
需要在kern/monitor.c里面添加代码,完成功能如下:
K> backtrace
Stack backtrace:
ebp f010ff78 eip f01008ae args 00000001 f010ff8c 00000000 f0110580 00000000
kern/monitor.c:143: monitor+106
ebp f010ffd8 eip f0100193 args 00000000 00001aac 00000660 00000000 00000000
kern/init.c:49: i386_init+59
ebp f010fff8 eip f010003d args 00000000 00000000 0000ffff 10cf9a00 0000ffff
kern/entry.S:70: <unknown>+0
K>
每一行都会输出文件名以及行(根据eip得到)。但是需要注意的是这个monitor+106并不是说在monitor的106行。而是说离monitor的开始有106个bytes。
// 一定要把文件名,函数名,等相应的信息另起一行进行输出。
Be sure to print the file and function names on a separate line, to avoid confusing the grading script.
printf("%.*s", length, string) 可以输出指定长度的字符串。
由于优化的原因,一些inline的函数会被编译到调用方的代码里面。所以看到的结果会少掉某些函数。这主要是-O2这个代码优化带来的。
求解 其实主要看上面格式的说明就行了。其他扯的太多,对求解作业不一定特别有用。
文件名
909 SO 0 2 f0101340 5591 lib/readline.c
所以在根据eip来查找的时候,首先找文件。以下代码来自于函数int debuginfo_eip(uintptr_t addr, struct Eipdebuginfo *info)。
lfile = 0 ;
rfile = (stab_end - stabs) - 1 ;
stab_binsearch(stabs, &lfile, &rfile, N_SO, addr);
if (lfile == 0 )
return -1 ;
函数
原函数
char *
strcpy(char *dst, const char *src)
{
char *ret;
ret = dst;
while ((*dst++ = *src++) != '\0')
/* do nothing */;
return ret;
}
解析之后得到
1131 FUN 0 0 f0101a69 6099 strcpy:F(0,20)=*(0,2)
1132 PSYM 0 0 00000008 6121 dst:p(0,20) <--- 栈中的偏移
1133 PSYM 0 0 0000000c 6133 src:p(0,19) <--- 栈中的偏移
1134 SLINE 0 33 00000000 0 // 00000000 ---> 33, 这里33就是表示函数定义的行号。
1135 SLINE 0 36 00000006 0 // 第一行代码相对文件的行号。
1136 SLINE 0 37 0000000c 0
1137 SLINE 0 37 0000000d 0
1138 SLINE 0 39 0000002b 0
1139 SLINE 0 40 0000002e 0
1140 LSYM 0 0 fffffffc 6145 ret:(0,20)
1141 LBRAC 0 0 00000000 0
1142 RBRAC 0 0 00000030 0
第一行是函数名。第二行是符号名,第三行SLINE开始是函数体里面的代码。LYSM表示函数局部变量符号。LBRAC表示函数左边的花括号。RBRAC表示函数右边的花括号。
所以当给定eip之后。搜索到file之后。就开始找函数名。
lfun = lfile;
rfun = rfile;
stab_binsearch(stabs, &lfun, &rfun, N_FUN, addr);
if (lfun <= rfun) {
if (stabs[lfun].n_strx < stabstr_end - stabstr)
info->eip_fn_name = stabstr + stabs[lfun].n_strx;
info->eip_fn_addr = stabs[lfun].n_value;
addr -= info->eip_fn_addr;
lline = lfun;
rline = rfun;
} else {
info->eip_fn_addr = addr;
lline = lfile;
rline = rfile;
}
info->eip_fn_namelen = strfind(info->eip_fn_name, ':' ) - info->eip_fn_name;
stab_binsearch这个函数有意思的地方是:输入参数lxxx, rxxx,进去的时候,即是限制范围。也是最后的返回值。
stabs
struct Stab {
uint32_t n_strx;
uint8_t n_type;
uint8_t n_other;
uint16_t n_desc;
uintptr_t n_value;
};
求解 root@debug:~/6.828 /lab# git diff
diff --git a/kern/kdebug.c b/kern/kdebug.c
index 9547143. .f85b570 100644
--- a/kern/kdebug.c
+++ b/kern/kdebug.c
@@ -180 ,6 +180 ,25 @@ debuginfo_eip(uintptr_t addr, struct Eipdebuginfo *info)
+ int olline = lline, orline = rline;
+ stab_binsearch(stabs, &olline, &orline, N_SOL, (!(lline == lfile && rline == rfile))*addr + info->eip_fn_addr);
+
+ if (olline > orline) {
+ stab_binsearch(stabs, &lline, &rline, N_SLINE, addr);
+
+ if (lline > rline) {
+ return -1 ;
+ }
+ }
+
+ info->eip_line = stabs[lline].n_desc;
+
diff --git a/kern/monitor.c b/kern/monitor.c
index e137e92..a0f188d 100644
--- a/kern/monitor.c
+++ b/kern/monitor.c
@@ -24 ,6 +24 ,7 @@ struct Command {
static struct Command commands[] = {
{ "help" , "Display this list of commands" , mon_help },
{ "kerninfo" , "Display information about the kernel" , mon_kerninfo },
+ { "backtrace" , "Display backtrace info" , mon_backtrace },
};
@@ -58 ,6 +59 ,30 @@ int
mon_backtrace (int argc, char **argv, struct Trapframe *tf)
{
+ uint32_t ebp = read_ebp();
+ uint32_t eip = 0 ;
+ struct Eipdebuginfo info;
+ #define TO_INT(x) *((uint32_t*)(x))
+ while (ebp) {
+ eip = TO_INT((ebp+4 ));
+ cprintf("ebp %08x eip %08x args %08x %08x %08x %08x %08x\n" ,
+ ebp,
+ eip,
+ TO_INT((ebp+8 )),
+ TO_INT((ebp+12 )),
+ TO_INT((ebp+16 )),
+ TO_INT((ebp+20 )),
+ TO_INT((ebp+24 )));
+
+ if (!debuginfo_eip(eip, &info)) {
+ cprintf("%s:%d: %.*s+%d\n" ,
+ info.eip_file,
+ info.eip_line,
+ info.eip_fn_namelen, info.eip_fn_name,
+ eip - info.eip_fn_addr);
+ }
+ ebp = TO_INT(ebp);
+ }
return 0 ;
}
diff --git a/lib/printfmt.c b/lib/printfmt.c
index 28e01 c9..1 d3a5fa 100644
--- a/lib/printfmt.c
+++ b/lib/printfmt.c
@@ -206 ,10 +206 ,13 @@ vprintfmt(void (*putch)(int , void *), void *putdat, const char *fmt, va_list ap)
case 'o' :
- putch('X' , putdat);
- putch('X' , putdat);
- putch('X' , putdat);
- break ;
+ num = getint(&ap, lflag);
+ if ((long long ) num < 0 ) {
+ putch('-' , putdat);
+ num = -(long long ) num;
+ }
+ base = 8 ;
+ goto number;
case 'p' :
出错记录
输出ebp的时候,输出成了TO_INT(ebp)
N_SOL表示内联函数引进来的代码行。在处理的时候需要处理掉。
当没有找到函数的时候。一定要注意:
468 FUN 0 0 f0100690 3954 mon_backtrace:F(0,1)
472 SLINE 0 60 00000000 0
473 SLINE 0 80 00000007 0
474 SOL 0 0 f01006a3 2929 ./inc/x86.h
475 SLINE 0 214 00000013 0 <-- 这一行是在x86.h里面的read_ebp()
476 SOL 0 0 f01006a5 3661 kern/monitor.c
477 SLINE 0 82 00000015 0
478 SLINE 0 84 00000017 0
479 SLINE 0 85 00000051 0
480 SLINE 0 82 00000053 0
481 SLINE 0 88 00000057 0
483 LBRAC 0 0 00000000 0 // 左花括号
484 RBRAC 0 0 00000062 0 // 左花括号
*/
if (lline == lfile && rline == rfile) {
// 如果没有找到函数,那么addr就没有被减过
stab_binsearch(stabs, &lline, &rline, N_SOL, info->eip_fn_addr);
} else {
// 如果找到过函数,那么addr就被减过了
stab_binsearch(stabs, &lline, &rline, N_SOL, addr += info->eip_fn_addr);
}这段代码可以简化成如下代码